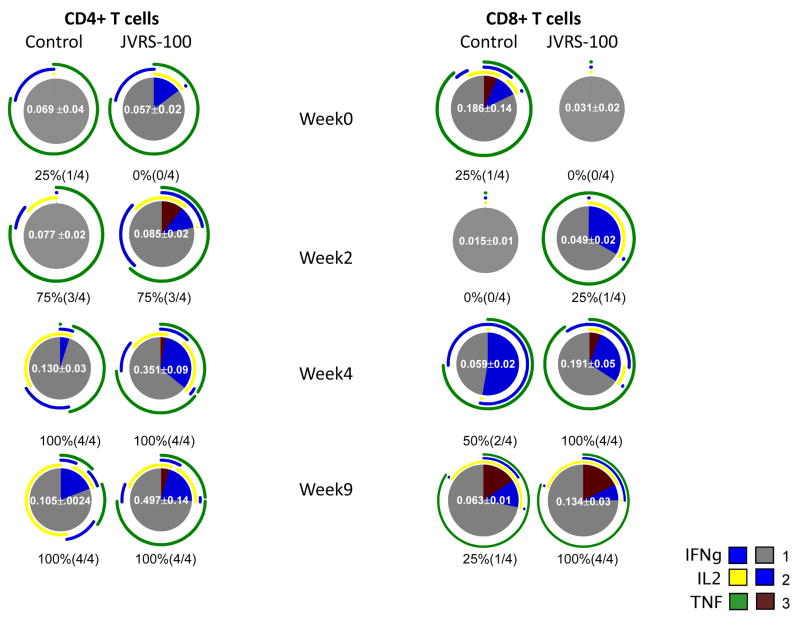
Fig. 7.
Fluzone®-specific multifunctional cytokine production by rhesus monkey T cells is increased after 22.5μg (high dose) JVRS-100-adjuvanted Fluzone® vaccination compared to Fluzone® alone. The response to Fluzone® stimulation is shown. The pie charts summarize the mean T cell responses of all immunized animals and the extent to which the CD4+ and CD8+ T cell responses were polyfunctional. For each pie chart the percentage (and proportion) of responding animals is indicated below the chart. The mean frequency (± s.e.m.) of each response is shown as a white number in the middle of the pie chart; only animals with a positive response are included. Each portion of a pie chart indicates the percentage of Fluzone®-specific T cells that responded with one, two, or three functions; and the arcs around the pie show the function or combination of functions to which the specific response corresponds (see color legend). Where arcs overlap this indicates that cells were secreting two or three cytokines in response to stimulation with Fluzone®. All differences are below statistical significance in this pilot study (n=4/group) with the exception of CD4+/IL-2+/TNF-α+ cells at 4 weeks (P=0.002) and 9 weeks (P=0.01).

