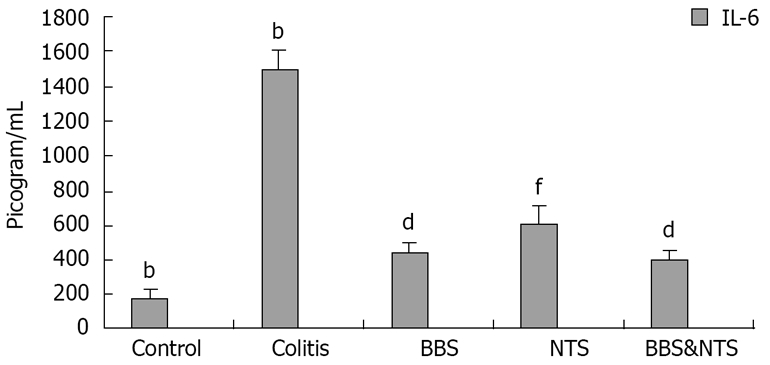
Figure 2.

Serum interleukin-6 (IL-6) concentrations in rats. Vertical columns and error bars represent mean ± SD. bP < 0.001 vs BBS, NTS and BBS&NTS; dP < 0.001 vs control, colitis and NTS; fP < 0.001 vs control, colitis and BBS and BBS and NTS. BBS: Bombesin; NTS: Neurotensin.
