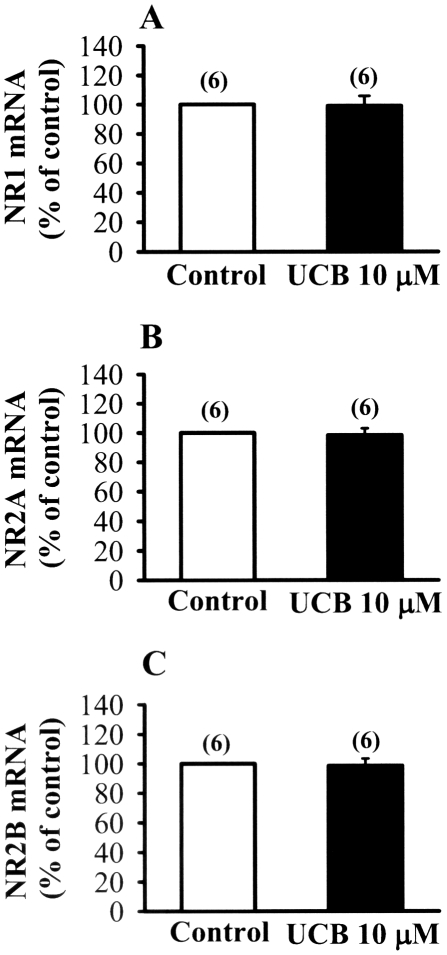
Figure 5. Effect of prolonged UCB exposure on the expression of NR1, NR2A and NR2B mRNAs.
(A–C) Real time-PCR analysis showing the relative expression of hippocampal CA1 NR1 (A), NR2A (B) and NR2B (C) mRNAs in slices from control and 10 µM UCB treatment for 48 h. Number of experiments is indicated in the parenthesis. Error bars indicate SEM.

