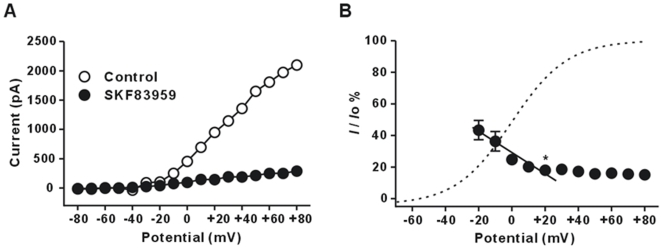
Figure 5. Effects of (±) SKF83959 on the current-voltage relationships of the delayed rectifier K+ current in rat hippocampal neurons.
(A) Current-voltage (I/V) curves of the delayed rectifier K+ current (I K) obtained in a representative neuron in control and during superfusion of (±) SKF83959 (100 µM). (B) Plot of the relative amplitudes of I K during superfusion of (±) SKF83959 (100 µM) as a function of the test potential. Each symbol represents the mean±S.E.M. (n = 7). The solid line is the linear fit, while the dashed line is the activation curve obtained in control condition. *P<0.01 (one-way ANOVA test) versus the value at −20 mV.

