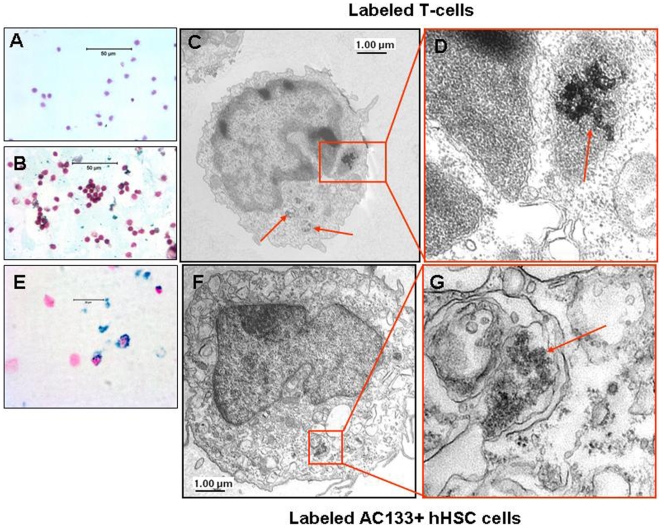
Figure 3. FePro labeled T and AC133+ hHSCs cells.
Microphotography DAB-enhanced PB staining of non-labeled T-cells (A, bar = 50 µm) and T cells labeled with 100 µg/ml Fe and 3 µg/ml Pro for 4 h (B, bar = 50 µm). Note the intracellular localization of FePro complexes that appear as the dark brown granules on electron microscopic images (arrows). Electron microscopy images of T-cells (C–D, bar = 1 µm) and AC133+ HSCs (F–G, bar = 1 µm) cells labeled with 100 µg/ml Fe and 3 µg/ml Pro for 4 h. Prussian blue staining of AC133+ HSCs cells (E, bar = 20 µm).

