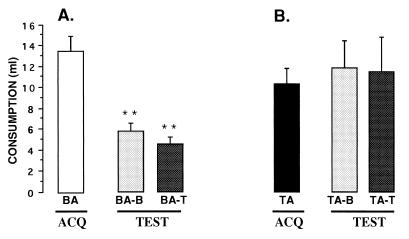
Figure 2.
Mean volume of saccharin consumption (± SEM) during acquisition and test of CTA. (A) The control group (BA) that received buffer in the NBM during acquisition in the test trial showed a significant saccharin aversion regardless of the treatment received during the test trial. That is, both the control group (BA-B) and the group that received TTX (BA-T) during the CTA test, showed taste aversion. (B) When TTX was perfused during the acquisition trial (TA), the buffer (TA-B) or TTX (TA-T) groups were not able to show taste aversion. ∗∗, paired t test; P < 0.01.

