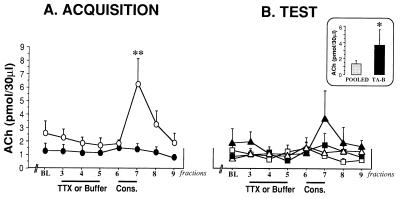
Figure 3.
Mean extracellular levels of ACh in the IC during TTX or buffer perfusion in the acquisition trial (A) and during TTX or buffer perfusion in the retrieval trial (B). (Inset) The ACh release observed in the seventh fraction, after the consumption of the aversive stimuli. The group TA-B was compared with the pooled BA-B, BA-T, and TA-T groups. (BL = mean of the two first samples). ○, BA group; ●, TA group. ▵, BA-B group; ▴, TA-B group; □, BA-T group; ■, TA-T group. Values are means ± SEM. ∗∗, P < 0.01, ∗, P < 0.05.

