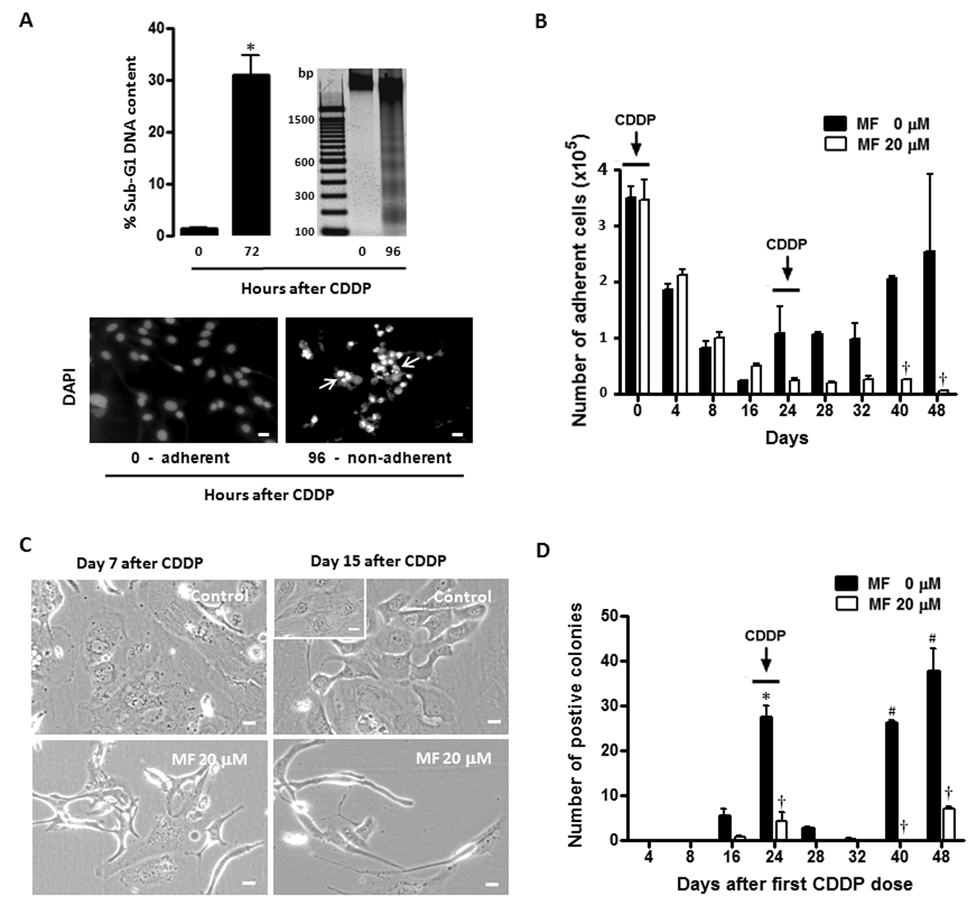
Figure 4.
Effect of chronic cytostatic concentrations of MF on the fate of SK-OV-3 cells exposed to 2 rounds of CDDP. SK-OV-3 were seeded, allowed to attach to the plate surface for 48 h, exposed to vehicle (0.9 % saline) or 50 µM CDDP for 1 h, and subsequently cultured in CDDP-free medium. (a) 72 h or 96 h after CDDP treatment, cells were respectively either pelleted, permeabilized, labeled with propidium iodide, and the sub-G1 DNA content was assessed by microcapillary cytometric analysis, or instead the genomic DNA was isolated, separated by agarose electrophoresis, stained, and photographed (upper panels). *, P < 0.05 relative to values at 0 h. Bar = mean ± SEM. 96 h after CDDP treatment, non-adherent cells were re-adhered to a microscope slide, stained with DAPI, photographed using a fluorescence microscope and compared against adherent cells of vehicle-treated cultures (lower panels). Arrows, apoptotic nuclei. Scale bar = 20 µm. In a second experiment, cells were treated with 50 µM CDDP for 1 h on days 0 and 24. After each treatment, CDDP was removed and the cells were cultured without or with MF every 2 days. Every 4 days number of adherent cells was measured by microcapillary cytometry (b), whereas the clonogenic capacity of viable cells was studied in a clonogenic survival assay (d). Values in panels (b) and (d) represent the means of a representative experiment performed in triplicates ± SEM. This experiment was repeated 4 times with similar outcomes. *, P < 0.05 relative to MF-free control values on day 4; #, P < 0.05 relative to MF-free control values on day 28; †, P < 0.05 relative to time-matched MF-free controls. (c) Morphology of adherent cells observed 7 or 15 days following exposure to CDDP alone (Control) or to the combination of CDDP and 20 µM MF. The inset in the upper right panel represents normally growing, untreated SK-OV-3 cells. Scale bar = 20 µm.

