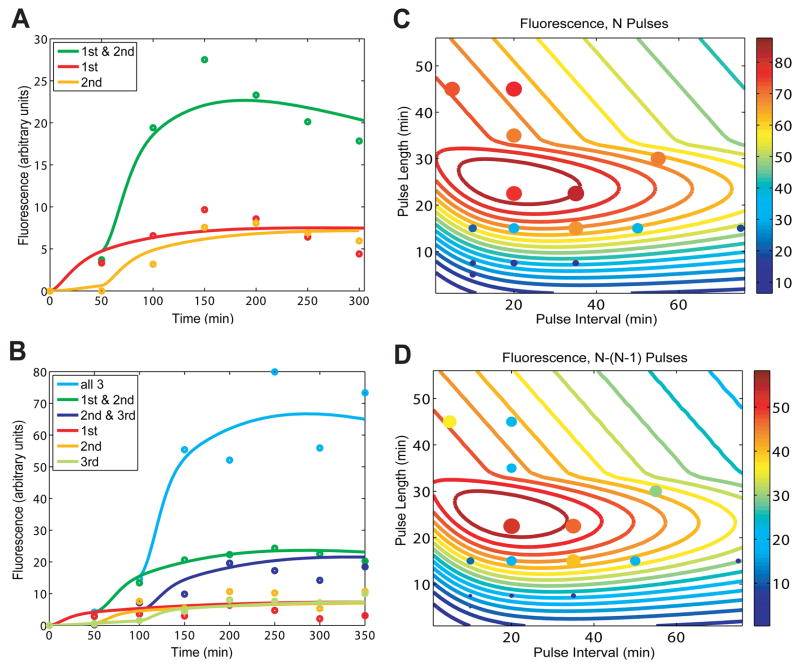
Fig 2.
Modeling predictions and RTC 3-Counter experimental characterization. (A) A model with fitted parameters captures the salient features of the normalized fluorescence results of the RTC 2-Counter. (B) An expanded model, again with fitted parameters, matches the normalized fluorescence results of the RTC 3-Counter. (C) Based on parameters fitted in (B), the model predicts expression output of the RTC 3-Counter across a range of pulse lengths and intervals, and these calculations were used to generate the colored contour lines. Solid circles represent experimental results, with both color and size of circles indicating the level of expression. (D) Similar to (C), except values shown are the difference in expression output after three pulses and two pulses.

