
Figure 4. Effect of proteasome inhibitor treatment on voltage-gated Ca2+ channel currents and Ca2+ influx.
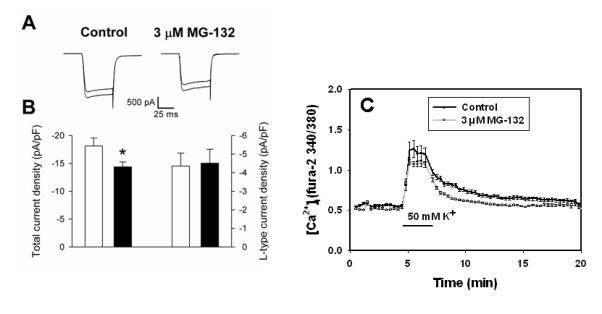
A. Representative Ca2+ currents elicited by voltage steps from -70 to 0 mV in a neuron treated with control medium and a neuron treated with 3 μM MG-132 for 4 hr. Currents were recorded in each neuron in the absence (larger trace) and presence (smaller trace) of 5 μM nifedipine. The capacitance of the control neuron was 24.7 pF and that of the MG-132-treated neuron was 25.6 pF. B. Summary of the total Ca2+ current density (two left-most bars) and the Ca2+ current density carried by L-type channels (two right-most bars) in control (open bars) and MG-132-treated (filled bars) neurons. n = 11-12; *P < 0.04. No statistically significant difference was observed in the L-type current density. C. Cultured neurons were sham-washed (Control) or treated with 3 μM MG-132 for 4 hr. Cultures were loaded with fura-2 and [Ca2+]i was imaged as in Figure 1. After 5 min, cultures were changed into media supplemented with 50 mM K+ for 2 min, then returned to control medium. Values shown are mean ± SEM 340/380 ratio for n= 96-100 cells per condition.