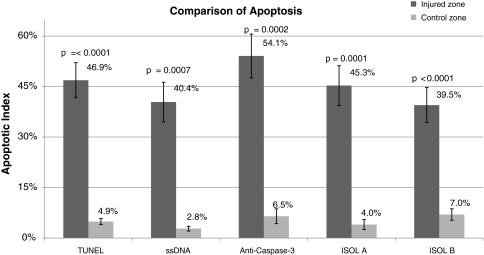
Fig. 2.
A graph compares the apoptotic indices in the injured zone and control zone using TUNEL, ssDNA, anti-active caspase-3, ISOL A (single 3′ base overhang), and ISOL B (blunt DNA ends). Error bars represent standard errors of the mean. The apoptotic indices in the control versus the injured zones were statistically different in all test groups; the representative p values are above each paired control and injured group. TUNEL = terminal deoxynucleotidyl transferase end labeling; ssDNA = DNA denaturation analysis using anti single-stranded DNA antibody; ISOL = in situ oligonucleotide ligation.

