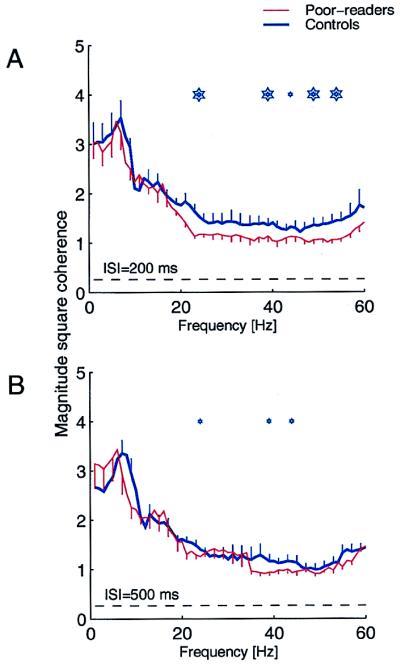
Figure 3.
Average transformed magnitude coherence across sensors expressed over a 750-ms period after the first stimulus of a pair in good readers (thick blue) and poor readers (thin red), at 200 ms (A) and 500 ms (B) ISIs. Mean ± one-sided jackknife errors are shown. The dashed line indicates the coherence obtained by random chance. Stars indicate the center of 5-Hz nonoverlapping sliding frequency windows in which coherence is statistically significant (for small stars P < 0.01, and large stars, P < 0.001). Significant differences were observed in β- and γ-band ranges (20–60 Hz).

