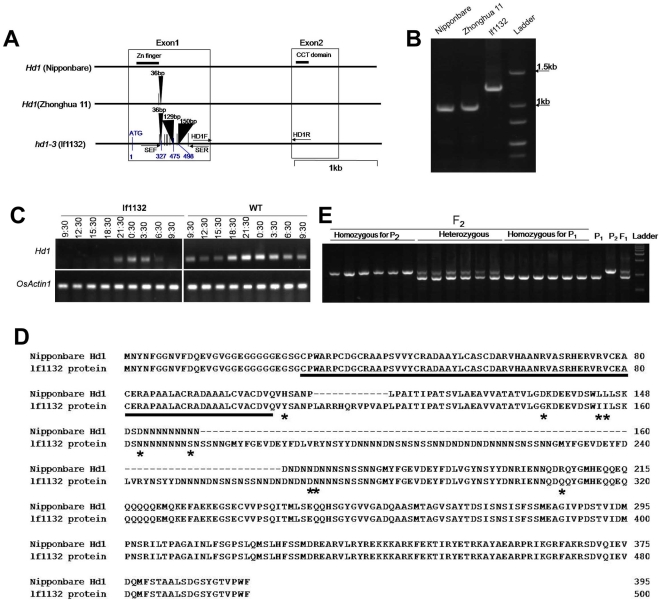
Figure 3. Sequence analysis of Hd1 in lf1132 and wild type.
A: The sequence differences between wild type and lf1132. The black triangle represents insertion; vertical lines represent single-base substitutions; blue vertical lines and numbers are relative positions in hd1-3. SEF and SER shown by arrows are primers to detect the 315 bp insertion. B: PCR detection of the 315 bp insertion on the hd1-3 locus for lf1132. C: The expression of Hd1 in the wild type and mutant. Leaves were harvested from 30 day old seedlings at the indicated times (once every 3 h for 24 h) in natural fields (day-length is about 14 h light and 10 h dark) and RT-PCR was carried out for the analysis of Hd1 expression. Primer pairs HD1F and HD1R were used for the analysis of Hd1 expression in RT-PCR. D: Deduced amino acid sequence of the Hd1 and deduced lf1132 proteins. The black line indicates the zinc-finger domain; asterisks are amino acid substitutions between the Nipponbare Hd1 protein and the deduced lf1132 protein. E: the linkage analysis of the mutant and Hd1 locus. P1 is Zhonghua 11; P2 is lf1132.

