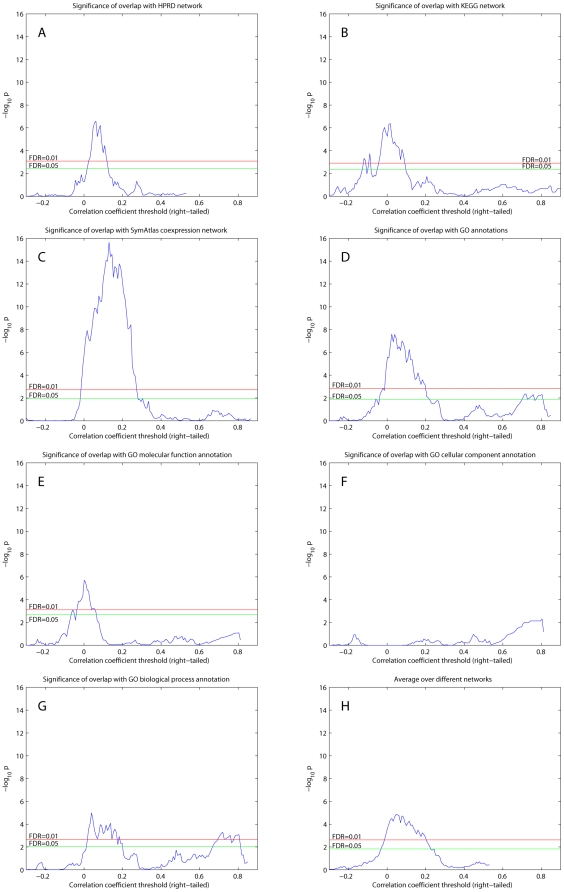
Figure 1. Overlap significance between right-tailed thresholded RH networks and existing datasets.
(A) HPRD protein-protein interaction network. (B) KEGG pathway network. (C) SymAtlas coexpression network. (D) GO annotations. (E) GO molecular function annotation. (F) GO cellular component annotation. (G) GO biological annotation. (H) Averaged  values over results from A to G. One-sided Fisher's exact and chi-square tests used to assess overlap significance.

