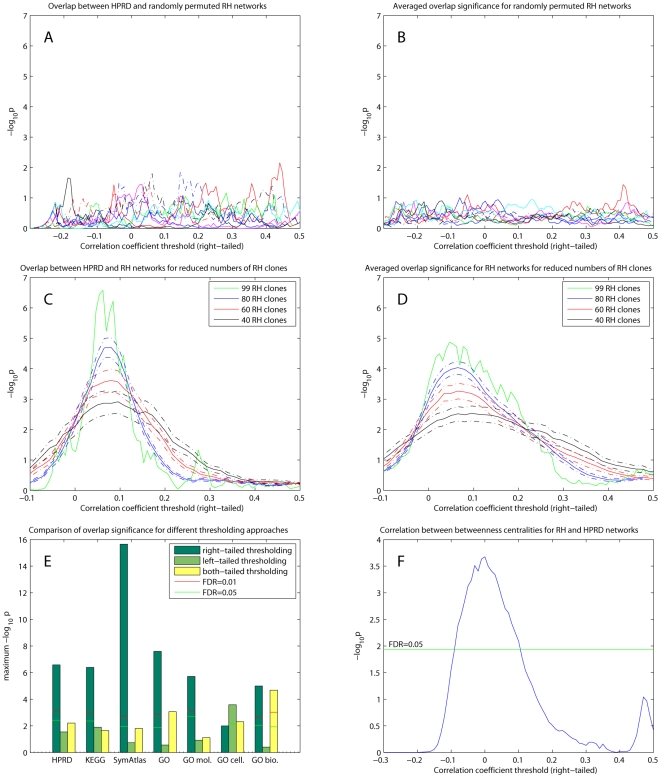
Figure 2. Comparison of RH networks and existing datasets.
(A) Overlap between 10 randomly permuted RH networks and HPRD network. The RH networks were constructed from right-tailed thresholding and one-sided Fisher's exact and chi-square tests used to assess significance. (B) Averaged  values for overlap between randomly permuted RH networks and different existing datasets (HPRD, KEGG, SymAtlas coexpression, GO, GO-molecular function, GO-cellular component and GO-biological process annotation networks). (C) Overlap between RH networks constructed from a subset of randomly selected RH clones and HPRD network. Mean of overlap significance (solid line) over 50 random subsets shown with standard errors calculated by bootstrapping (dash-dot line). (D) Same as (C) except averaged
  values over different existing datasets. (E) Comparing different thresholding approaches. Maximum
  over varying correlation coefficient thresholds shown. (F) Comparing betweenness centralities of RH and HPRD networks. P-values of Spearman correlation coefficients (one-sided, positive direction) between the betweenness centralities of RH and HPRD networks shown.

