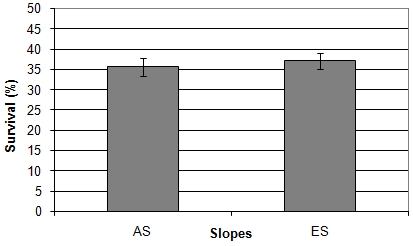
Figure 4. Total averaged survival score of the “African” (AS) and “European” (ES) strains (UVC radiation).

n = 23 for each slopes. The bars represent standard errors. The averages are not significantly different (Mann-Whitney test, p = 0.436).

n = 23 for each slopes. The bars represent standard errors. The averages are not significantly different (Mann-Whitney test, p = 0.436).