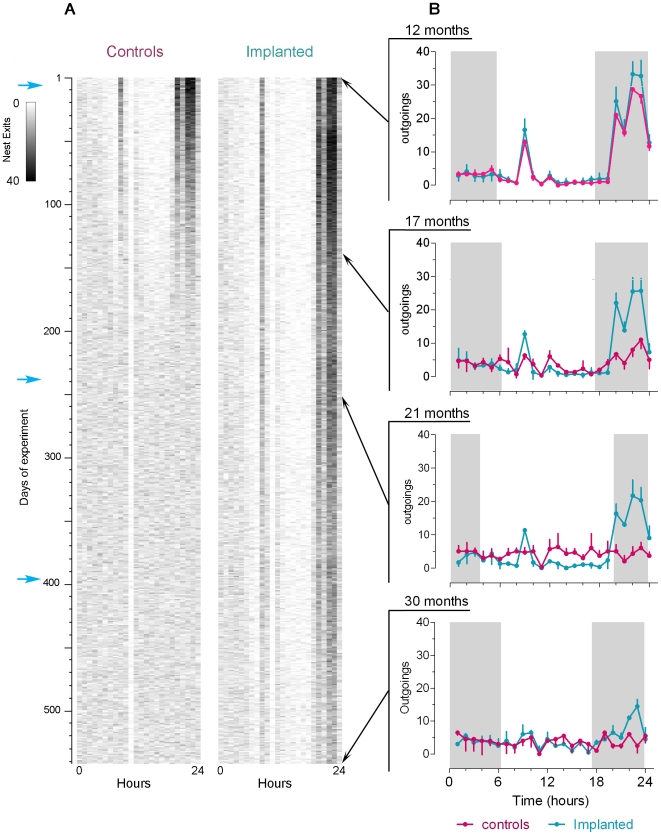
Figure 3. Shrews' locomotor activity over the duration of the experiment.
A: Actograms of a control and a melatonin-implanted shrew from the age of 12 to 30 months. Each line corresponds to one experimental day and there are 24 boxes per line (one box per hour). Nest exits are expressed as a grey scale: the darker the area, the higher the activity for a particular period. Blue arrows indicate each time a new implant was supplied. B: Daily activity profiles (mean±SEM) of controls (red) and melatonin-implanted (blue) shrews at, respectively, 12, 17, 21 and 30 months after the beginning of the experiment. Shrews were submitted to a natural light–dark regime. Grey boxes correspond to the night. Due to mortality, the number of individuals decreased during the experiment so that n was 11, 9, 6 and 4 at respectively month 12, 17, 21, and 30.

