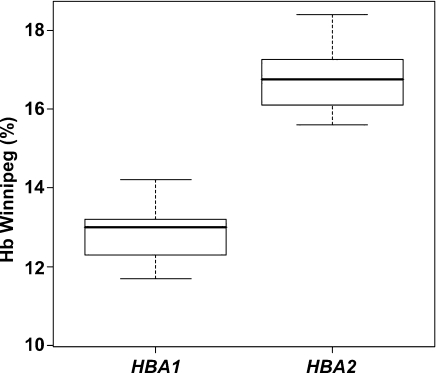
Fig. 1.
Box plots (p < 0.001) indicating the range and mean values (thick black lines) of the Hb Winnipeg variant percentage between carriers bearing the HBA1 or HBA2 mutation. In our evaluation, the Hb Winnipeg/α-thalassemia compound heterozygous case, as well as the cases described in Ref. [32], is excluded

