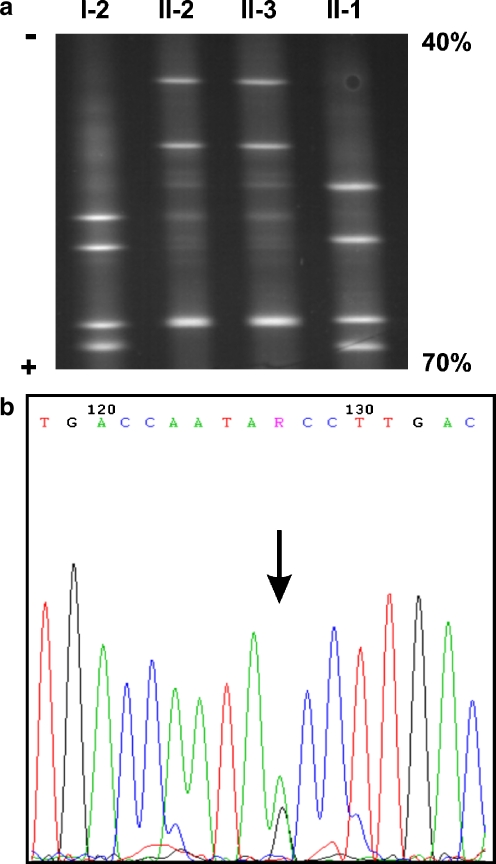
Fig. 2.
a DGGE analysis of the promoter region of the HBG2 gene. Numbering correlates with the family tree in Fig. 1a. Note the mutant HBG2:g.-158 T (lower band) and HBG2:g.-109 T homoduplexes (upper band) that comigrate in lanes II-2 and II-3, compared to lanes I-2 and II-1, respectively. The 40–70% denaturing gradient corresponds to the top and bottom of the gel, respectively. b DNA sequencing analysis, performed in the forward and reverse (not shown) orientation, revealing a G>T transition at position −109 of the HBG2 gene promoter (arrow)

