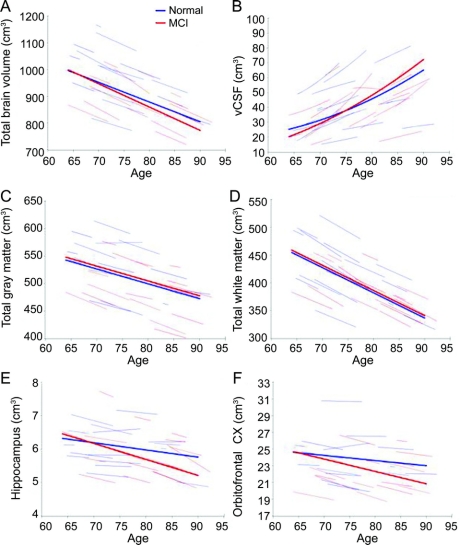
Figure 1 Trajectories of select brain volume changes (cm3)
Age-related changes in (A) whole brain volume, (B) ventricular CSF (vCSF), (C) total white matter, (D) total gray matter, (E) hippocampus, and (F) orbitofrontal cortex. Thin red (mild cognitive impairment [MCI]) and blue (normal) lines represent individual volumes over time for a random sample of participants; thick red and blue lines indicate respective estimated average volumes for each group. Increase in vCSF accelerates with age. The hippocampus and orbitofrontal cortex decline linearly with increasing age and at a steeper rate in the MCI group. Males show steeper changes in whole brain and vCSF volume decline.

