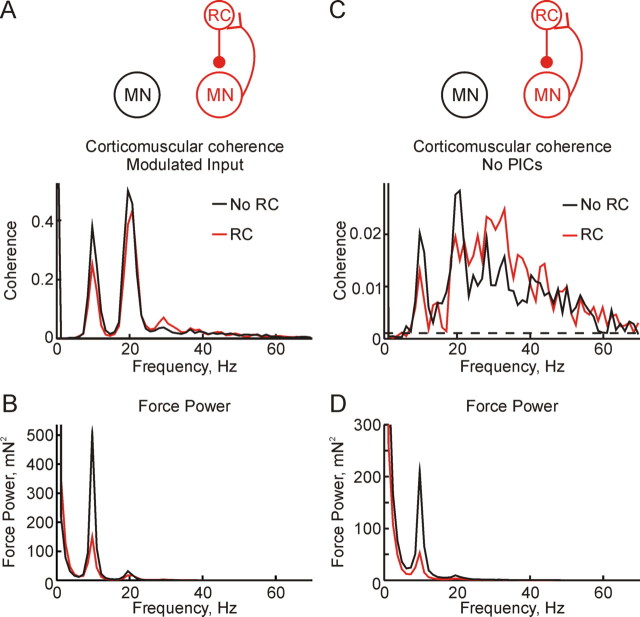
Figure 5.
A, B, Results from simulations which used a cortical input modulated to contain power-spectral peaks at 10 Hz and 20 Hz. C, D, Results from simulations which omitted PICs from the motoneuron model. Top row (A, C) shows corticomuscular coherence; bottom row (B, D) shows force power spectrum. Black lines relate to simulations without Renshaw cells and red lines to simulations in which they were included. Simulation length throughout was 2880 s.

