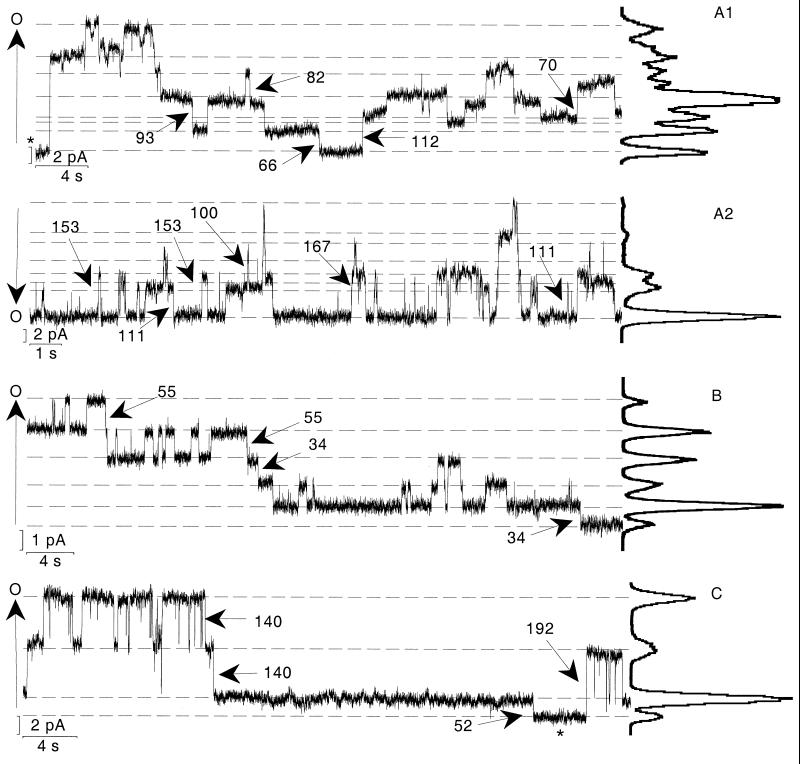
Figure 2.
Multichannel records obtained from A7r5 (A1 and A2), Rat-1 (B), or N2A-Cx40 (C) cells. The A7r5 cells display event amplitudes not observed in the Rat-1 or N2A-Cx40 cells. In the all-points histograms for the Rat-1 and N2A cells, peaks are narrow, they begin and end at baseline, and their separations correspond to actual event amplitudes. In the all-points histograms for the A7r5 cells, peaks are broad, they do not begin and end at baseline, and peak separations do not correspond to actual event amplitudes. Transjunctional voltage was 40 mV throughout the A7r5 and N2A-Cx40 records except at the asterisks (in A1 and C), where it was 0 mV. Transjunctional voltage was 30 mV throughout the Rat-1 record.

