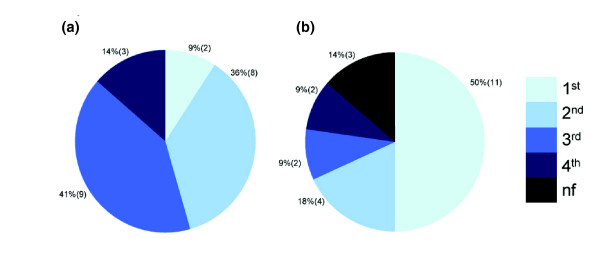
Figure 4.
Specificity of the COS(WR) algorithm compared to ESEfinder. A pie chart representing prediction results for four SFs - SF2/ASF, SRp40, SRp55, and SC35 - obtained from screening experimentally validated sequences using (a) ESEfinder and (b) COS(WR). The different slices represent the percent of true SFBS predictions in the first, second, third, and fourth ranks (color scale is shown on the right). As shown, using the COS(WR) approach, 50% of predictions were ranked at the top rank, while only 9% were top ranked using ESEfinder. nf, not found.

