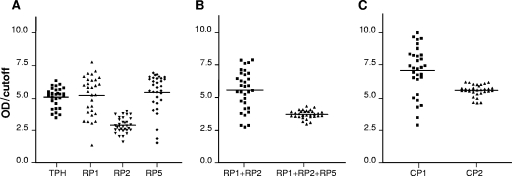
FIG. 2.
Relative OD distribution obtained for a panel of 32 Chagas' disease-positive serum specimens, using all the Ags studied. Horizontal lines show the discrimination efficiency values (the mean OD values of the positive samples tested divided by the cutoff value). (A) TPH and the isolated peptides RP1, RP2, and RP5. (B) RP1+RP2 mixture and RP1+RP2+RP5 mixture. (C) CP1 (fused RP1-RP2) and CP2 (fused RP1-RP2-RP5).

