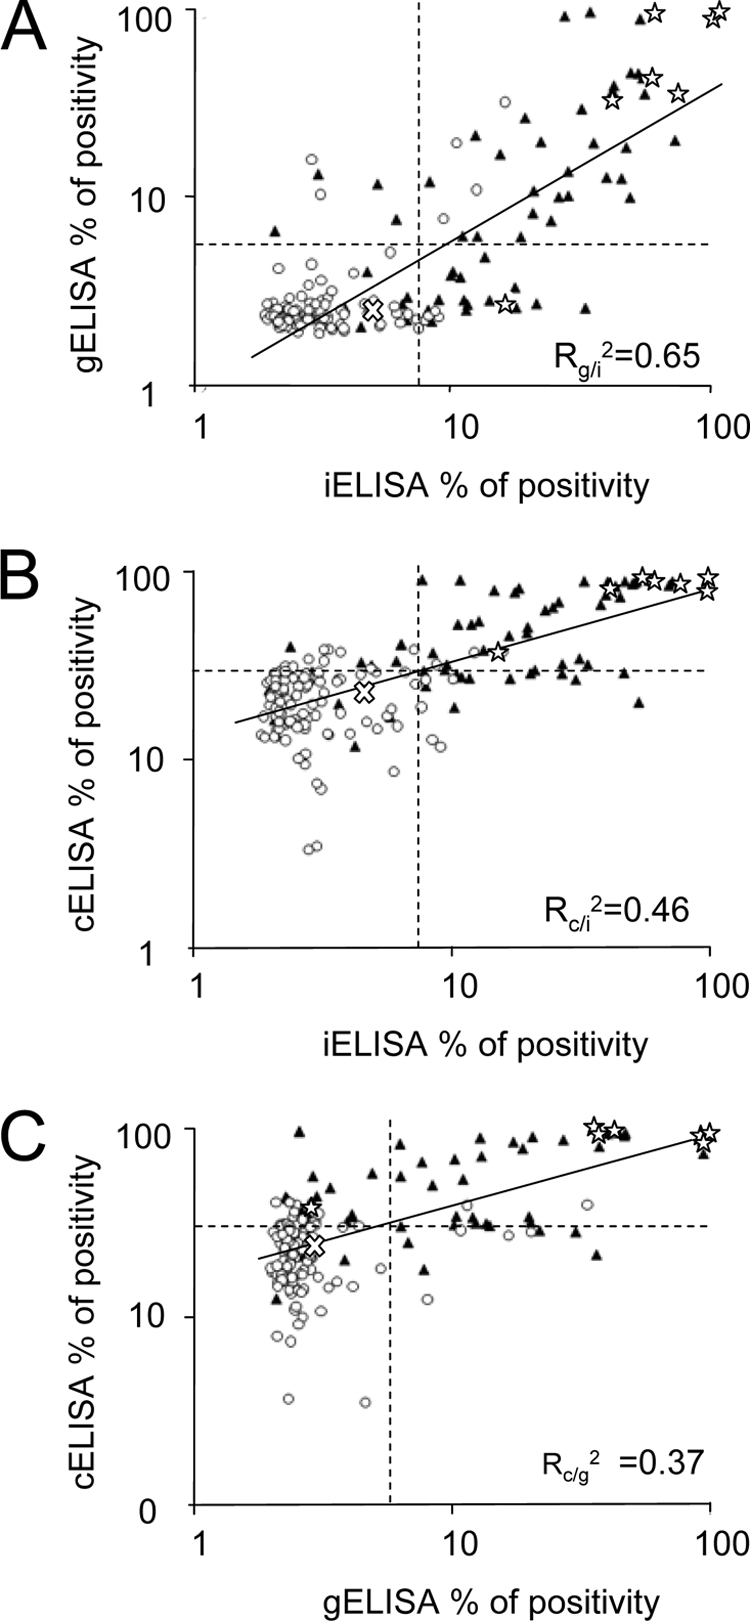
FIG. 4.

Distribution of positive and negative RBT serum samples in relation to ELISA values and correlation among the three different ELISAs. A total of 179 serum samples from 17 different species of odontocetes were tested by iELISA, gELISA, cELISA, and RBT. (A) Correlation between iELISA and gELISA. (B) Correlation between iELISA and cELISA. (C) Correlation between gELISA and cELISA. The cutoff values indicated by the dotted lines correspond to 7.5%, 6.0%, and 30.6% positivity for iELISA, gELISA, and cELISA, respectively. White circles represent RBT-negative reactions, black triangles RBT-positive reactions, stars serum samples from culture-positive dolphins (all with positive RBT reactions), and the white “X” the maximum value obtained by a negative control serum in the ELISAs. The best-fit correlation line (solid line) and the respective R2 values are indicated. Notice that one B. ceti culture-positive serum sample lies within the negative values of gELISA.
