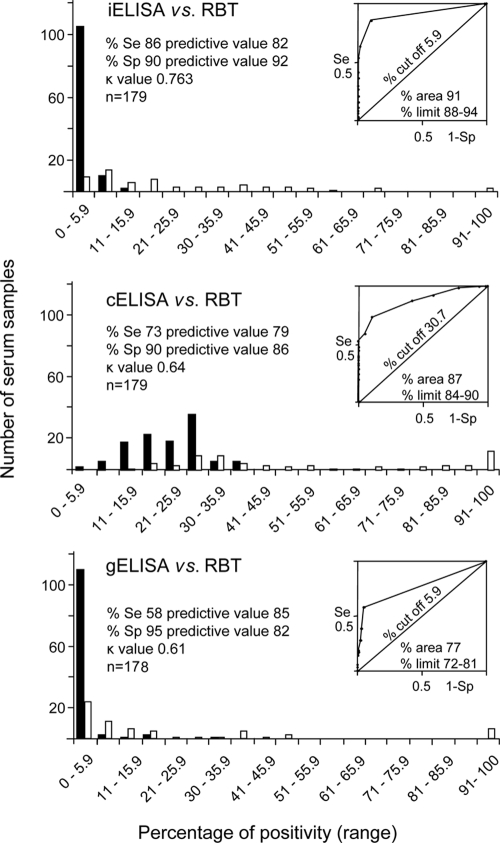
FIG. 6.
Determination of ELISAs' sensitivities and specificities, using RBT as the reference assay. Cutoff values expressed as percentages of positivity were theoretically determined on ROC curves according to values approaching the highest sensitivity and specificity with reference to predictive percentages. Kappa values (κ) for each experiment are indicated. Black bars designate negative serum samples, and white bars designate positive serum samples. Se, sensitivity; Sp, specificity.

