FIG. 3.
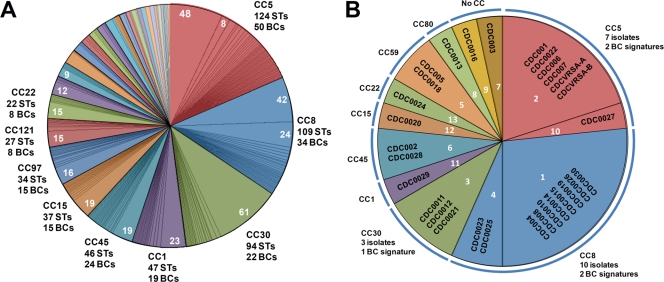
Distribution of PCR/ESI-MS base composition signatures compared to that of clonal complexes determined with MLST STs. (A) The distribution of STs in clonal complexes (CCs) is shown as colored pie slices. Subdivisions within each clonal complex represent the distribution of theoretical base composition signatures for the PCR/ESI-MS S. aureus genotyping panel. Labels outside the chart indicate the number of MLST types assigned to that complex and the number of distinct base composition signatures (BCs). Numbers within the pie slices indicate the number of distinct STs yielding the same theoretical base composition signature. Minor unlabeled complexes are, in clockwise order from the first (orange) unlabeled pie slice, as follows: 59, 89, 25, 80, 398, 12, 7, 20, 50, 101, 96, 130, 395, 705, 49, 126, 182, 295, and 305. These groups contain from three to 13 STs and from one to five base composition signatures each. (B) The distribution of characterized isolates is shown as differently colored pie slices. The distribution of CDC isolates into different PCR/ESI-MS base composition signatures is shown by segmentation of the pie slices, and the PCR/ESI-MS number groupings are indicated in white. Each set of CDC isolates sharing a specific base composition signature is displayed within a segment. In all cases, PCR/ESI-MS base composition signatures correlated with sequence types belonging to only one clonal complex. There were isolated cases where a base composition signature was also consistent with STs not assigned to a clonal complex: signature 1 is consistent with STs 380 and 619; signature 4 is consistent with ST 157; signature 2 is consistent with ST 529; signature 3 is consistent with STs 42, 353, and 847; signature 5 is consistent with ST 559; signature 11 is consistent with STs 339 and 774; and signature 13 is consistent with ST 498.

