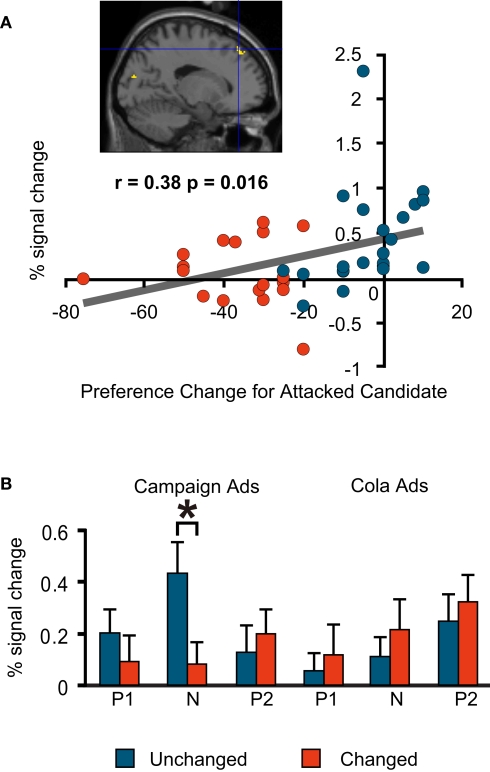
Figure 4.
fMRI signal change at the medial prefrontal cortex (−16, 39, 44; BA8). (A) Correlation between the signal change during the negative advertisements and preference change towards a favoured candidate during the negative advertisements (=post-negative-advertisement preference for the attacked candidate – pre-negative-advertisement preference for the attacked candidate). Blue, Unchanged; red, Changed. Note that each plot represents an individual subject. (B) Mean comparison between the Unchanged and Changed Groups for each advertisement session. P1, Positive1; N, Negative; P2, Positive2. The asterisk indicates a significant difference at p < 0.05 (t-test). The error bars are the S.E.M.)

