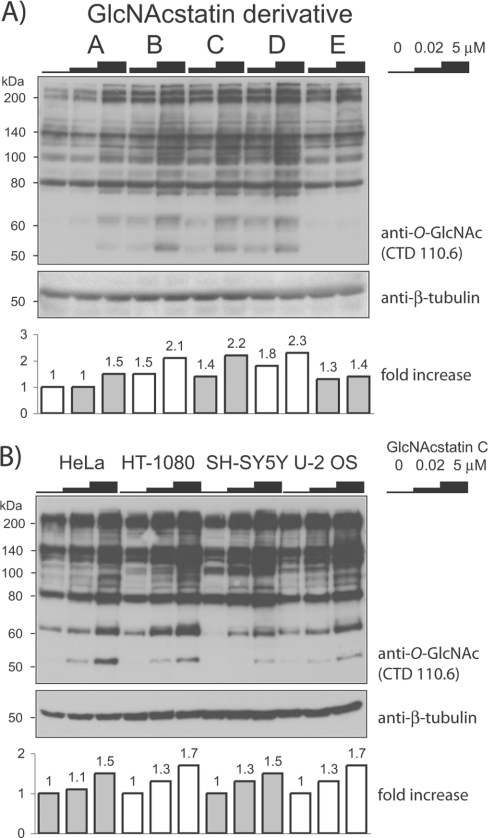
Figure 3. Immunoblot detection of O-GlcNAc modifications on cellular proteins using an anti-O-GlcNAc antibody.
The increase in O-GlcNAc levels in comparison with untreated samples is shown in the histogram underneath the blot. (A) HEK-293 cells were treated with GlcNAcstatins A–E for 6 h with the concentrations indicated. (B) GlcNAcstatin C was added to HeLa, HT-1080, SH-SY5Y or U-2 OS cells for 6 h with the identical inhibitor concentrations as in (A). The molecular mass in kDa is indicated on the left-hand side of each blot.

