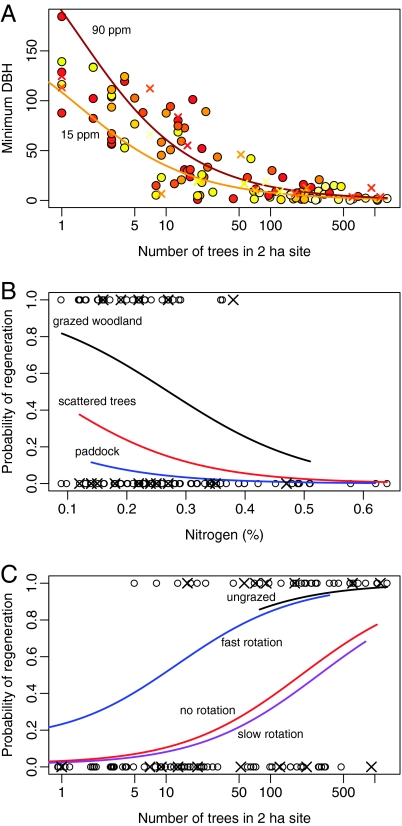
Fig. 3.
Significant predicted relationships from generalized linear mixed models (confidence intervals are not shown because methods for their calculation in the presence of random effects are controversial in statistical science; points denote primary survey sites, and crosses denote validation sites). (A) Minimum (standardized) diameter varied significantly in response to the number of trees at a site and available soil phosphorus (see Table S2 for details). Darker points indicate sites with higher phosphorus concentrations. The 2 lines denote low- and high-phosphorus conditions. (B) The probability of seedling presence varied significantly with the number of trees at a site and with the amount of soil nitrogen. The predicted relationship for the mean number of trees at the 3 grazed site types is shown, assuming continuous grazing (see Table S3 for details). (C) The probability of seedling presence also varied significantly between livestock rotation regimes. Pairwise differences were significant between either of the upper 2 predicted lines, and between either of the lower 2 predicted lines (P = 0.004; see Table S3 for details). The predicted relationship is based on mean total nitrogen concentrations (0.26%).

