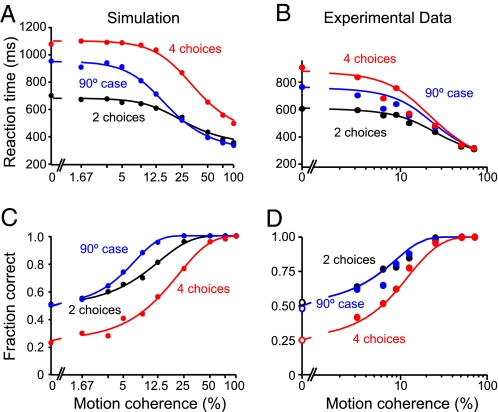
Fig. 2.
Speed and accuracy of simulated decisions and comparison to experimental data (13). (A) Simulated mean reaction times of correct trials as a function of motion coherence, fitted by a hyperbolic tangent function (see SI Methods). Decisions among 4 possible choices take longer than between 2 alternatives, whereas reaction times in the case of 2 choices 90° apart are intermediate between 2 and 4 choices for low coherence values. (B) Mean reaction times of 2 monkeys performing the RDM task (see ref. 13 for details). (C) Simulated psychometric functions, fitted by Weibull functions (see SI Methods). Performance in the 4-choice task is lower than for 2 choices. In the 90° case, accuracy is similar to the standard 2-choice case, with even higher performance at intermediate motion coherence. One thousand trials were simulated for each data point. At low motion coherence, some trials had to be excluded in the 4-alternative condition (at most 2%) and in the 90° case (at most 5%), because they failed to reach a decision within the simulation time of 4,000 ms (see SI Methods). (D) Experimentally observed performance of monkeys in the RDM task. B and D are adapted with permission from Churchland et al. (13). Please note that the scales of the simulated and experimental data are identical. For better assignment in A and C, the simulated motion coherence values are used as labels.

