
Figure 2. Dose sensitivity of FTY720-mediated S1P1 modulation and induction of lymphopenia.
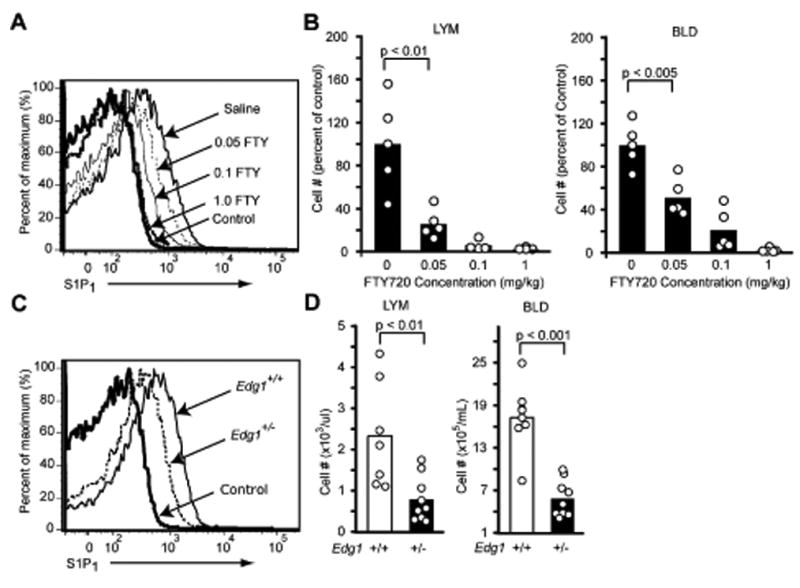
(A) FACS analysis of S1P1 on lymph node CD4+ T cells 4.5 h after in vivo treatment with the indicated amounts of FTY720. (B) Fraction of CD4+ T cells remaining in blood (BLD) and lymph (LYM) 4.5 h after treatment with the indicated amounts of FTY720 compared to saline treated controls. (C) FACS analysis of S1P1 on wild-type littermate control and Edg1+/- lymph node CD4+ T cells. (D) Number of CD4+ T cells in blood and lymph of wild-type and Edg1+/- mice. Data are representative of at least 3 mice for each condition. Bars represent means and dots individual mice.