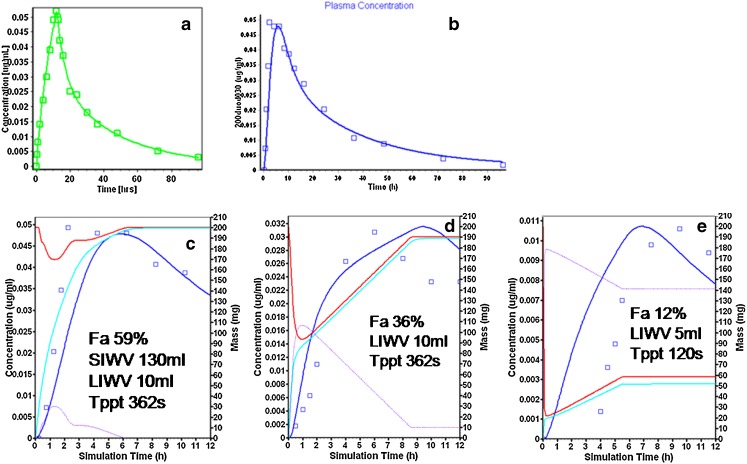
Fig. 2.
Sertraline modeling and simulation results. a Intravenous infusion (observed: squares, simulation: blue line). b Intraduodenal intubation showing the plasma concentration time profile (observed: squares, simulation: blue line). c ID, 0–12 h after administration: amount dissolved (red), amount absorbed (aqua), amount precipitated (purple), and the plasma concentration time profile (observed: squares, simulation: blue line). d ICJ intubation (see b for description of curves). e AC intubation (see b for description of curves)

