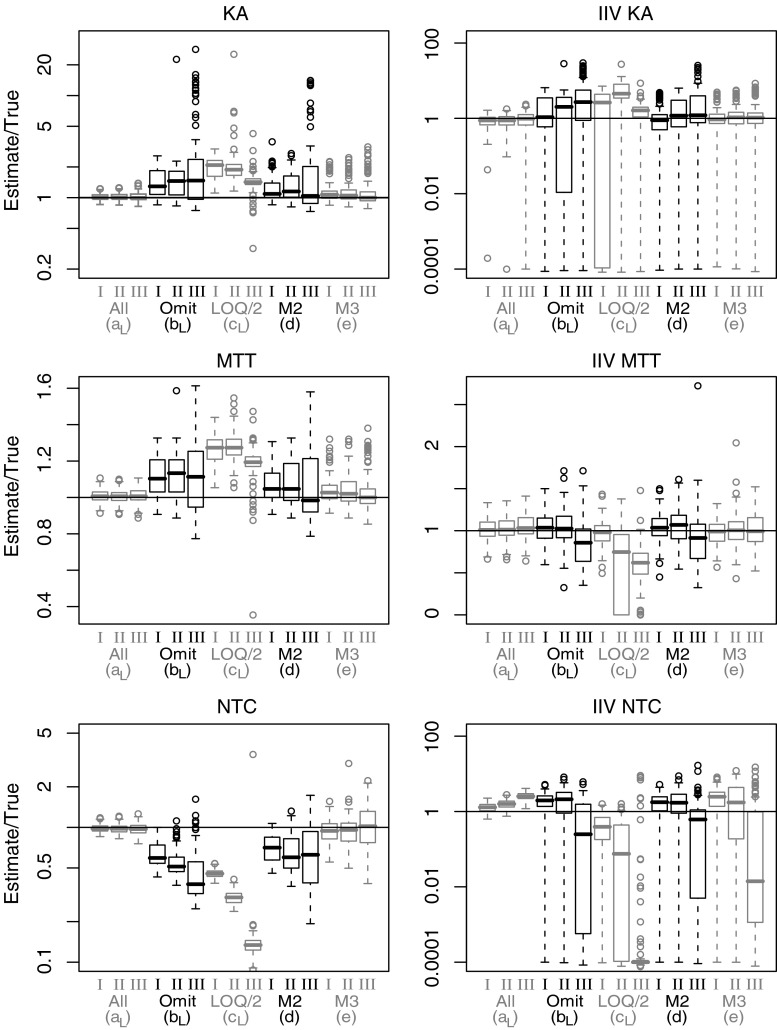
Fig. 1.
Box-plots depicting parameter estimates (n = 100 per box) divided by true parameter values for a selection of parameters from model A. Absorption rate constant (KA), mean transit time (MTT), number of transit compartments (NTC) and corresponding interindividual variability (IIV). Results presented for method a, b, c (Laplacian), d and e and for LOQ level I, II and III

