
Fig. 4.
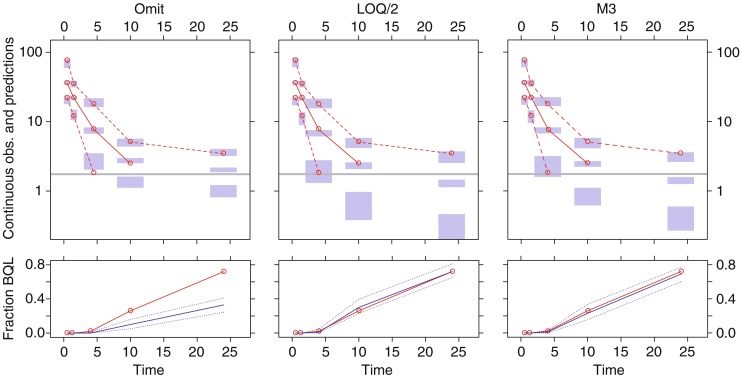
Example of visual predictive check (VPC) for model B (LOQ level II) following estimation with BQL data omitted (left), BQL dataset to LOQ/2 (middle), and the M3 method (right). The upper panels show simulation-based 95% confidence intervals around the 97.5th, 50th, and 2.5th percentiles of the continuous data in the form of blue areas. The corresponding percentiles from the observed data are plotted in red color (can only be plotted for observations above LOQ). The horizontal gray line represents the LOQ. The lower panels show simulation based 95% confidence intervals (dotted blue line) around the median (solid blue line) for the fraction of BQL observations. The observed fraction BQL samples are represented with a dashed red line