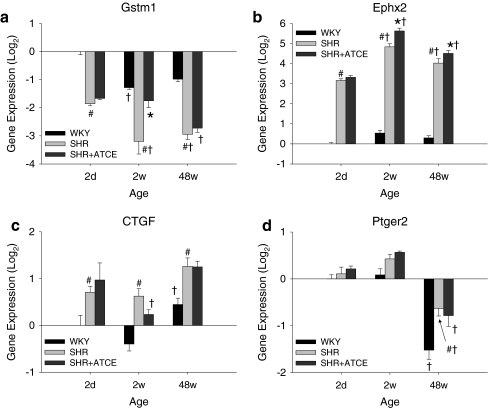
Fig. 1.
Real-time quantitative PCR of Gstm1 (a), Ephx2 (b), CTGF (c), and Ptger2 (d). There were five to six rats per group. All data are expressed relative to WKY at 2 days. Data were analyzed by two-way ANOVA. Different degrees of post hoc significances are all collected in P < 0.05 in order to decrease complexity of presentation. #P < 0.05 vs. WKY (same age), *P < 0.05 vs. SHR (same age), †P < 0.05 vs. younger age (same strain)

