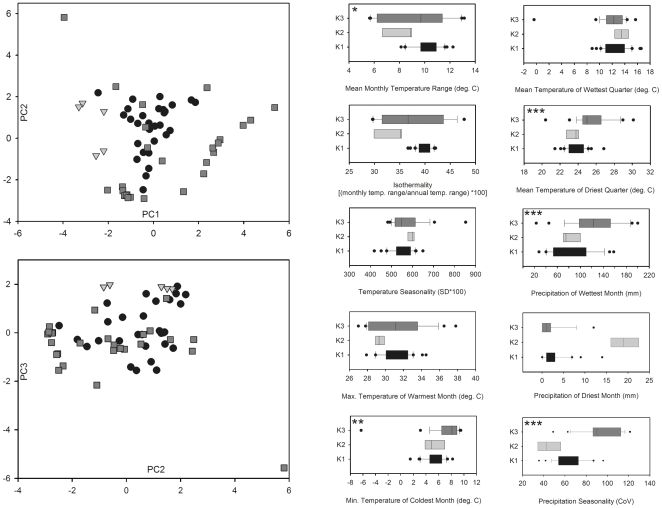
Figure 4. Comparison of bioclimatic variables experienced at localities sampled within each A. transcaspicus genetic cluster (see Figure 1).
A) Separation of clusters (K1: black circles, K2: light gray triangles; K3: dark gray squares) along the first (PC1) and second (PC2) or second and third (PC3) principal components derived from an analysis performed on variables shown in (B). B) Box plot comparisons among K1−K3 for individual climatic variables used for Maxent predictions. Significance of differences was tested by t tests only between K1 and K3, with K2 values shown only for comparison. * = P<0.05; ** = P<0.01; *** = P<0.001 (see Results for details on significant tests).

