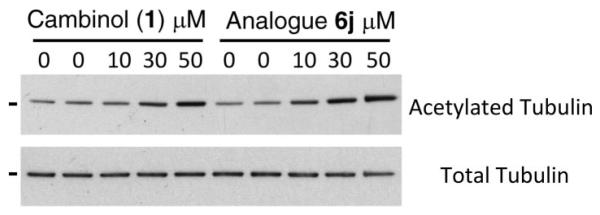
Figure 3.
Western blot analysis of the levels of α-tubulin acetylated at K40 and total α-tubulin in H1299 cells treated with increasing concentrations of cambinol (1) and analog 6j. All samples were also treated with trichostatin A, an inhibitor of class I and II HDACs, to reduce the background effect of these deacetylases. The black line represents the position of the 51KDa molecular weight marker. Samples were first analyzed with the K40-acetylated α-tubulin antibody and subsequently reloaded and analyzed with the antibody against total α-tubulin. For a more detailed statistical analysis of this experiment, see Supporting Information Figure S14.

