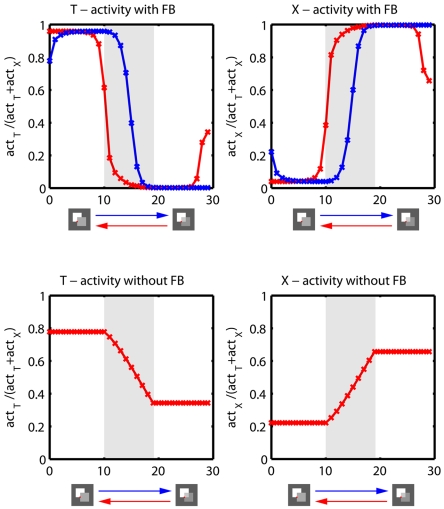
Figure 15. Hysteresis effect induced by feedback.
The figure illustrates T- and X-junction activities extracted from the model based on temporal input sequences of two occluding squares where the topmost square changes material appearance from opaque (100% opacity) to transparent (90% opacity) (blue lines) over time. Furthermore the sequence was presented in reverse temporal order leading to a change of material appearance back from transparent to opaque (red lines). Activities were extracted at positions indicated by the red dot on the stimulus. Illustrated are results based on model simulations with feedback (top row) and without feedback connections (bottom row). Gray shaded areas indicate periods where stimulus properties linearly change. The results demonstrate that feedback leads to a hysteresis effect by temporary locking the prediction for a junction type (T- or X-junction). Without feedback the hysteresis effect disappears and both input sequences produce exactly the same results (only red curve is visible). Furthermore, the results demonstrate that feedback helps to disambiguate initial junction signals by amplifying the most likely prediction and suppressing weak predictions over the first few iterations.

