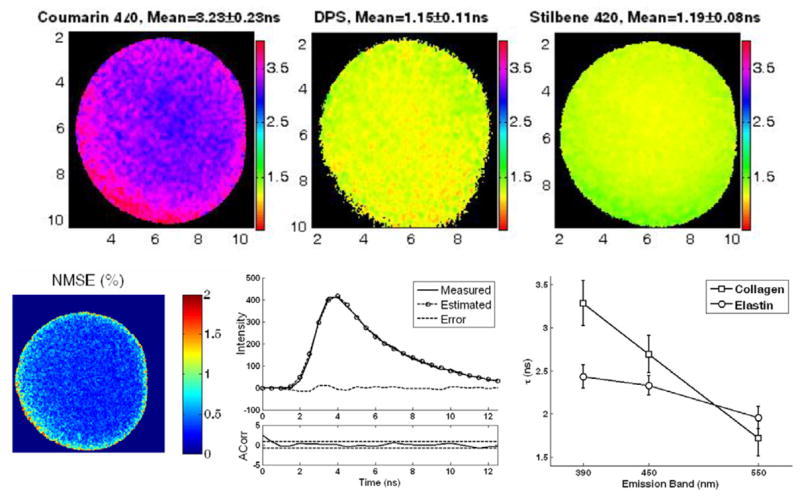
Figure 2.

Top: lifetime maps from the three different dye solutions Coumarin 440, DPS and Stilbene 420 (dissolved in ethanol) obtained with the 450, 390 and 450 nm bandpass filters, respectively. Bottom left: plot of normalized mean square error (NMSE) at every pixel, showing that it is less than 2% across the FOV. Bottom centre: a representative single pixel decay from Coumarin, together with the estimated fluorescence decay and autocorrelation. Bottom right: average lifetime obtained from the FLIM analysis of collagen and elastin with the 390 nm, 450 nm and 550 nm bandpass filters.
