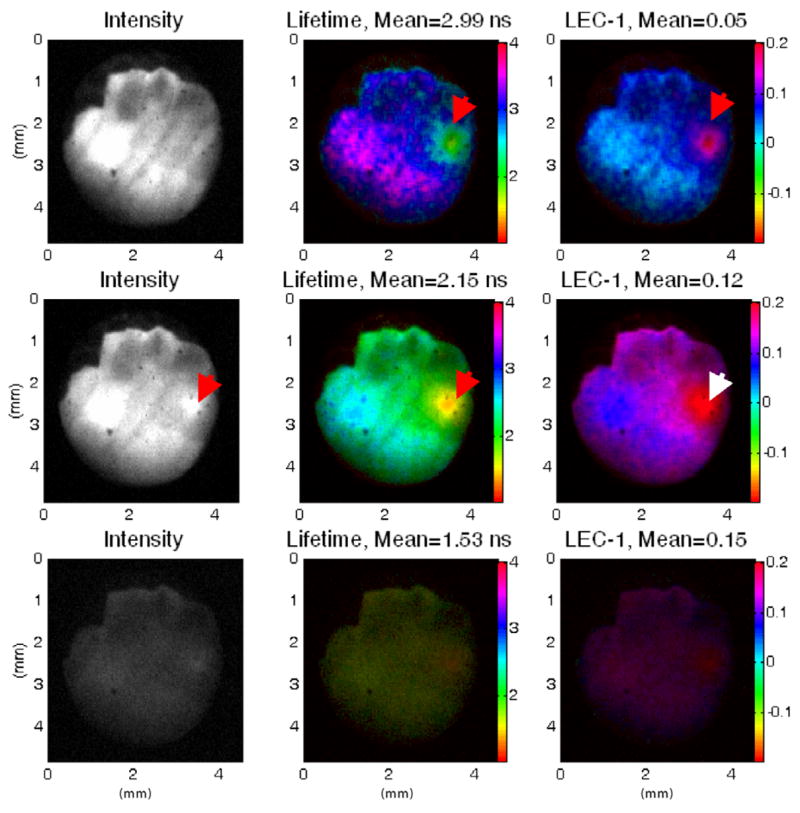
Figure 3.

FLIM images of rat aorta lumen showing the intensity (left), lifetime (middle) and Laguerre coefficient LEC-1 (right) maps, measured with the 390 nm (top), 450 nm (middle) and 550 nm (bottom) bandpass filters. The arrows indicate an area rich in elastin, which cannot be seen from the intensity maps at 390 nm but can be clearly detected in the lifetime and LEC-1 maps at that emission band. With the 450 nm emission band, the elastin-rich spot can also be clearly observed in the intensity map.
