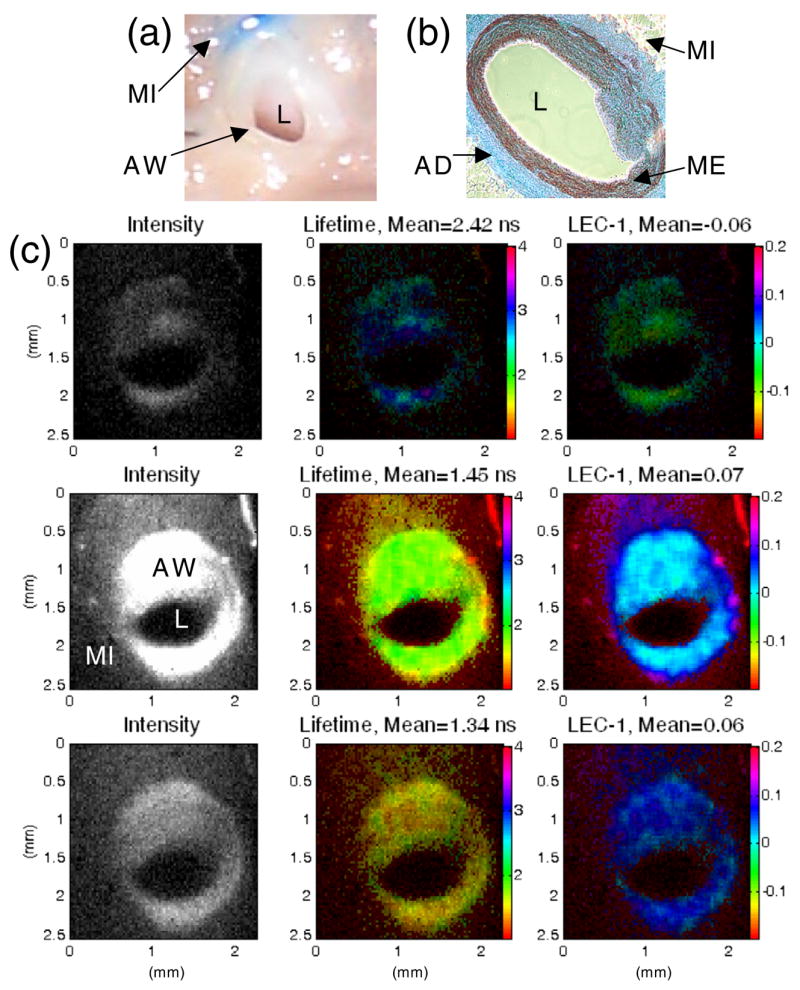
Figure 4.

(a) Photograph of the cross-section of the pig coronary artery, showing the arterial wall (AW), lumen (L), and surrounding myocardium tissue (MI). (b) Histology section showing the elastin rich media (ME) and collagen rich adventitia (AD) of the arterial wall. (c) FLIM images showing the intensity (left), lifetime (middle) and Laguerre coefficient LEC-1 (right) maps, measured with the 390 nm (top), 450 nm (middle) and 550 nm (bottom) bandpass filters. While the photograph does not show clear demarcation between AW and surrounding MI, the fluorescence intensity and lifetime maps shows contrast between the two tissue types. The intensities are higher and lifetimes are shorter at 450 nm, reflecting a strong elastin component in the AW. LEC-1 also shows high contrast between the coronary cross-section and surrounding tissues.
