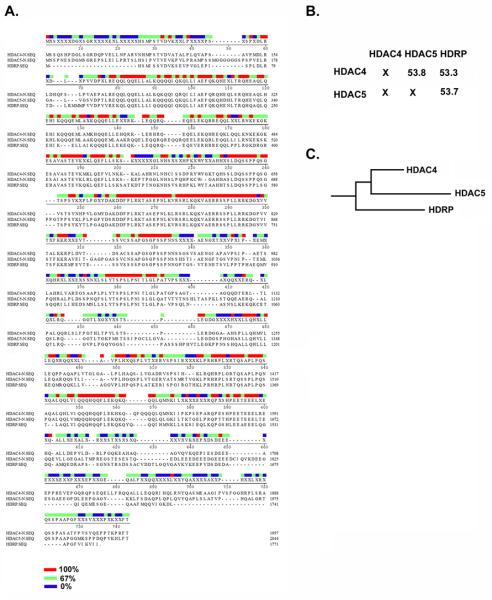
Fig. 2. HDAC4, HDAC5 and HDRP sequence similarities.
(A-B) The N-terminal protein sequences of human HDAC4 (653 aa), HDAC5 (682 aa) and HDRP are compared in this figure. (A) Protein sequences were aligned using the Jotun Hain method. Red, green and blue bars show 100%, 67% and 0% similarities amongst the three sequences respectively. (B) Percent similarities amongst the protein sequences are reported. This is a gross measure of similarity between sequences, derived by taking the matches over the matches, mismatches and gaps. (C) Phylogenic tree, showing the evolutionary relationship amongst HDAC4, HDAC5 and HDRP. Actual distances are not exact and may be greater than shown. MegAlign software was used for the generation of this data.

