
Figure 3. Detailed network mapping of the right frontal insula, a focus of neurodegeneration in bvFTD.
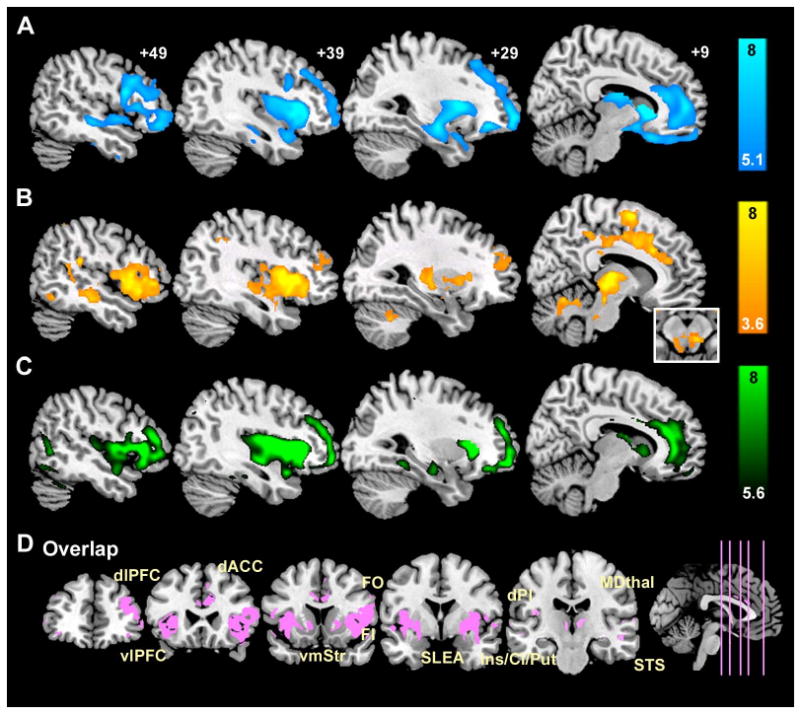
(A) Reduced gray matter volume in bvFTD vs. controls (P < 0.05, whole brain FWE corrected) occurs within regions showing (B) intrinsically correlated BOLD signals in controls (P < 0.001, whole-brain corrected height and extent thresholds) and (C) structural covariance in controls (P < 0.05, whole brain FWE corrected). These distributed spatial maps overlap (D) within a “network” that reflects known primate neuroanatomical connections. AI = anterior insula, dACC = dorsal anterior cingulate cortex, dlPFC = dorsolateral prefrontal cortex, dPI = dorsal posterior insula, FO = frontal operculum, MDthal = mediodorsal thalamus, SLEA = sublenticular extended amygdala, vlPFC = ventrolateral prefrontal cortex, vmStr = ventromedial striatum.