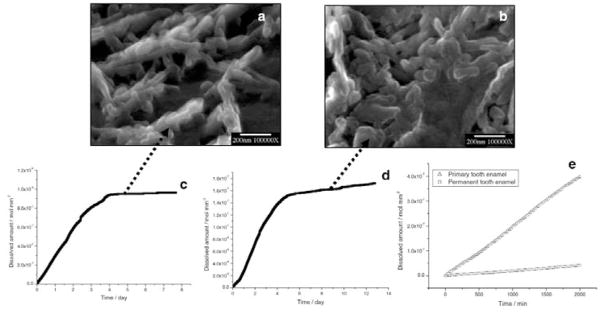
Figure 4.
Nanosized crystallites at the plateaux stages of dissolution of (a) primary and (b) permanent enamel collected by filtration from the bulk solution. CC curves of (c) primary and (d) permanent tooth enamel dissolution. The rates decreased virtually to zero at the end of dissolution reactions. (e) Comparison of dissolution rates of primary and permanent tooth enamel during the initial linear stages of dissolution.

