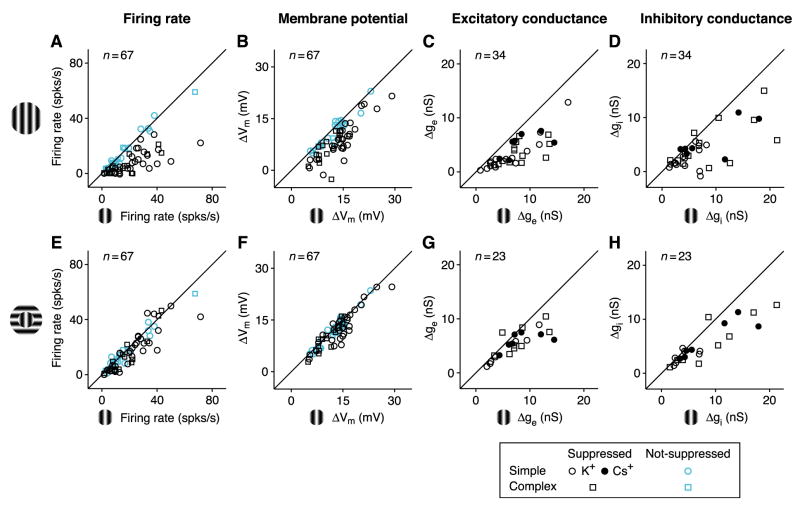
Figure 3. Surround suppression across the V1 population.
(A–D). Center-plus-surround response amplitude (surround at preferred orientation) plotted against center-only response amplitude for (A) firing rate (F1 component for 47 simple cells; DC component for 20 complex cells), (B) change in peak membrane potential, (C) change in peak excitatory conductance (21 simple; 13 complex), and (D) change in peak inhibitory conductance. For each graph, responses are measured relative to blank responses. Round and square symbols: simple and complex cells; open and closed symbols: K+–based or Cs+-based/QX-314 solution in recording pipette. In (A) and (B), cyan symbols indicate cells that showed no statistically significant suppression (17 simple, 6 complex).
(E–H) Same as (A)-(D), but with surround at the orthogonal orientation. (E) and (F), same population as (A) and (B); (G) and (H), 14 simple and 9 complex cells.

