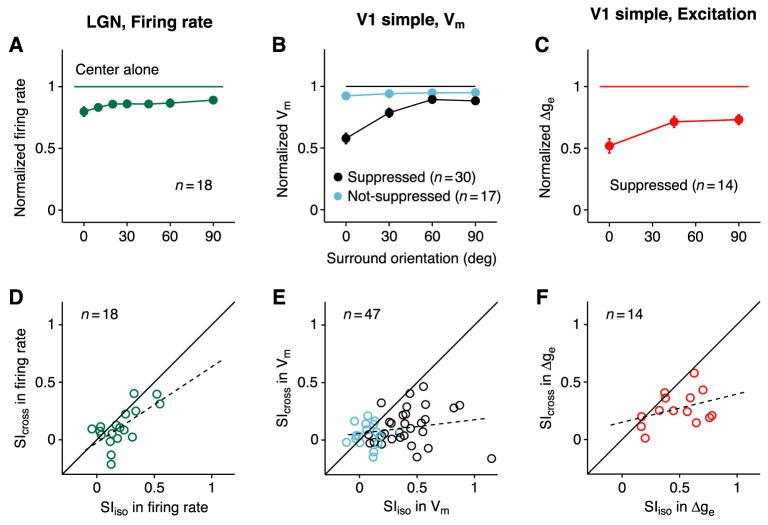
Figure 5. Comparison of surround suppression in LGN and V1.
(A) Orientation-tuning of firing rate for 7 surround orientations (relative to center orientation), normalized to the center-only response and averaged across 18 LGN cells. The size of the center stimulus was optimal for cortical cells, and not for LGN cells (see text). Normalized responses to iso-oriented and cross-oriented surround (mean ± s.e.m.): 0.80 ± 0.04 and 0.89 ± 0.03.
(B) Orientation-tuning curve of membrane potential, normalized and averaged across V1 simple cells. Black and cyan indicate surround suppressed and non-suppressed cells. Center-normalized responses to iso-oriented and cross-oriented surround: suppressed, 0.58 ± 0.04 and 0.88 ± 0.03; non-suppressed, 0.92 ± 0.03 and 0.95 ± 0.02.
(C) Excitatory conductance in surround-suppressed simple cells. Center-normalized responses: iso-oriented surround, 0.52 ± 0.06; cross-oriented surround, 0.73 ± 0.04.
(D–F) Suppression indices (SI) for iso- and cross-oriented surround plotted against one another.
(D) Firing rate in LGN cells.
(E) Membrane potential in surround-suppressed (black, n=30) and non-suppressed (cyan, n=17) simple cells.
(F) Excitatory conductance in surround-suppressed simple cells. Dashed lines: linear regressions.

