
Figure 1.
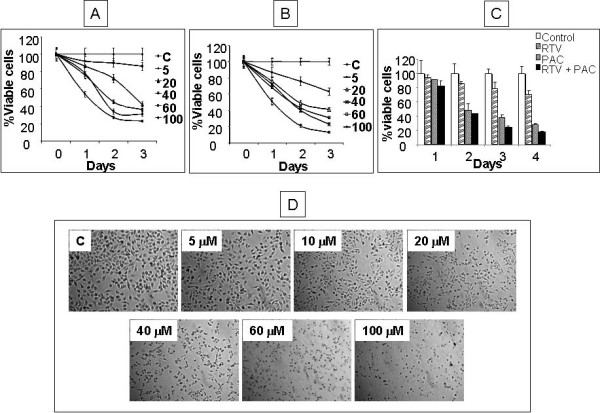
Effect of ritonavir on the growth of ovarian cancer cell lines. MDAH-2774 cells (A) and SKOV-3 cells (B) were cultured for indicated times at various concentrations of the ritonavir. Cell growth was assessed by CCK-8 cell proliferation assay method and is expressed as a percentage of control (DMSO treated cells) and represents the mean of triplicate cultures. C. MDAH-2774 cells were incubated with either 15 μM ritonavir (RTV) or 1 μM paclitaxel (PAC) or both and cultured for 4 days. Data is representation of three independent experiments. D. MDAH-2774 cells were incubated with indicated RTV concentrations for 48 hrs and were photographed under a phase contrast microscope. Representative fields of two independent experiments are shown.