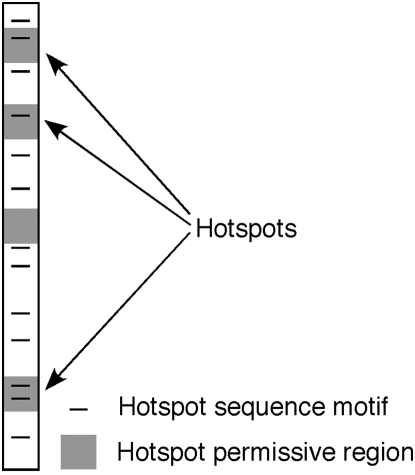
Figure 6.—
Model to explain the location of recombination hotspots. The large rectangle indicates a portion of a chromosome. Shaded regions indicate regions of the genome that are permissive for recombination hotspots. In S. pombe, these regions coincide primarily with large intergenic regions (Cromie et al. 2007). Solid lines indicate hotspot sequence motifs. Hotspots occur where these two chromosomal features coincide.

