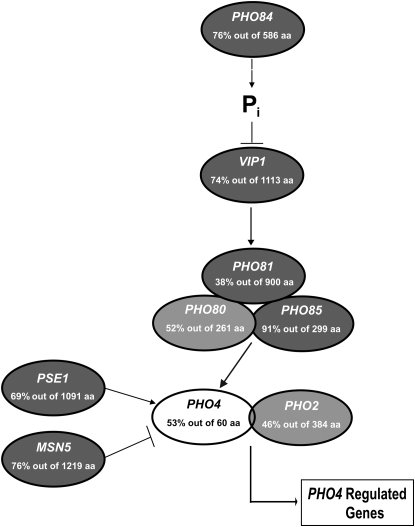
Figure 1.—
Genomic sequence predicts a C. glabrata PHO pathway similar to S. cerevisiae. The values indicate the percentage of amino acid identity and the number of amino acids over which the identity was measured by BLASTP alignment. Shading of each component differs on the basis of the expect (E) value for each C. glabrata ortholog. Components with an E value <10−100 are darkly shaded; E values >10−100 are lightly shaded; and E values >10−10 are open. Systematic C. glabrata names are given in Table 2.

